Debug
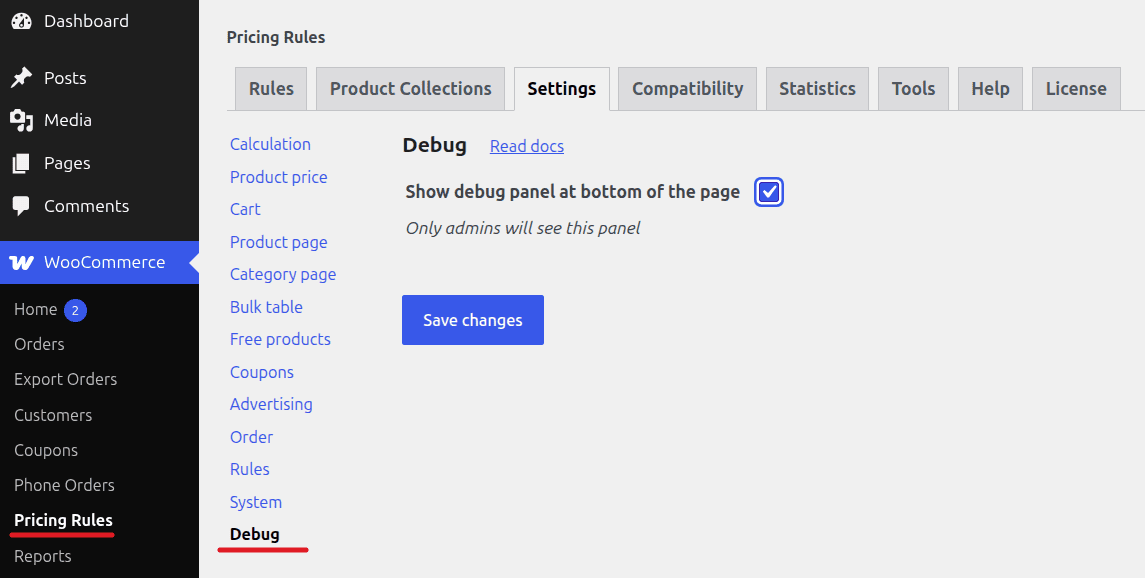
When a pricing rule doesn’t apply the way you expect — or when a discount shows the wrong amount, fires on the wrong products, or doesn’t fire at all — the Debug panel in Advanced Dynamic Pricing for WooCommerce gives you a real-time view into the plugin’s internal pricing engine. Enable it from Advanced Dynamic Pricing → Settings → Debug, and a panel appears at the bottom of every page on your site showing exactly what the plugin calculated, which rules it evaluated, and how long each one took to process.
Only logged-in administrators can see the debug panel. Your customers never see it, regardless of which page they visit.
How to Enable the Debug Panel
- Go to Advanced Dynamic Pricing → Settings → Debug.
- Turn on “Enable debug bar”.
- Save the settings.
- Visit any page on your site — the debug panel appears at the bottom of the screen.
⚠️ Turn the debug panel off when you finish troubleshooting. While customers can’t see it, leaving it active adds a small processing overhead to every page load, which you don’t want running permanently in a production environment.
Debug Panel Tabs
The panel contains five tabs, each targeting a different layer of the plugin’s output.
Tab 1 — Cart

The Cart tab shows a full breakdown of everything the plugin applied to the current cart session. It splits into four sections:
Items lists every product currently in the cart with detailed information about the discount applied to each one — the original price, the calculated price, the rule that triggered the discount, and the discount amount. If a product should carry a discount but shows the full price, this section tells you immediately whether the rule fired at all or whether it fired but calculated an unexpected value.
Coupons shows all WooCommerce coupons currently active in the cart alongside any coupon-based interactions with the plugin’s rules. Use this section when coupon stacking behaviour doesn’t match your expectations.
Fees displays any cart-level fees the plugin added through active Cart/Shipping Discount rules configured as fees. If a fee appears in the cart but you can’t identify its source, this section names the rule responsible.
Shipping shows information about the currently selected shipping method and whether any shipping discount rules affected it.
Tab 2 — Products
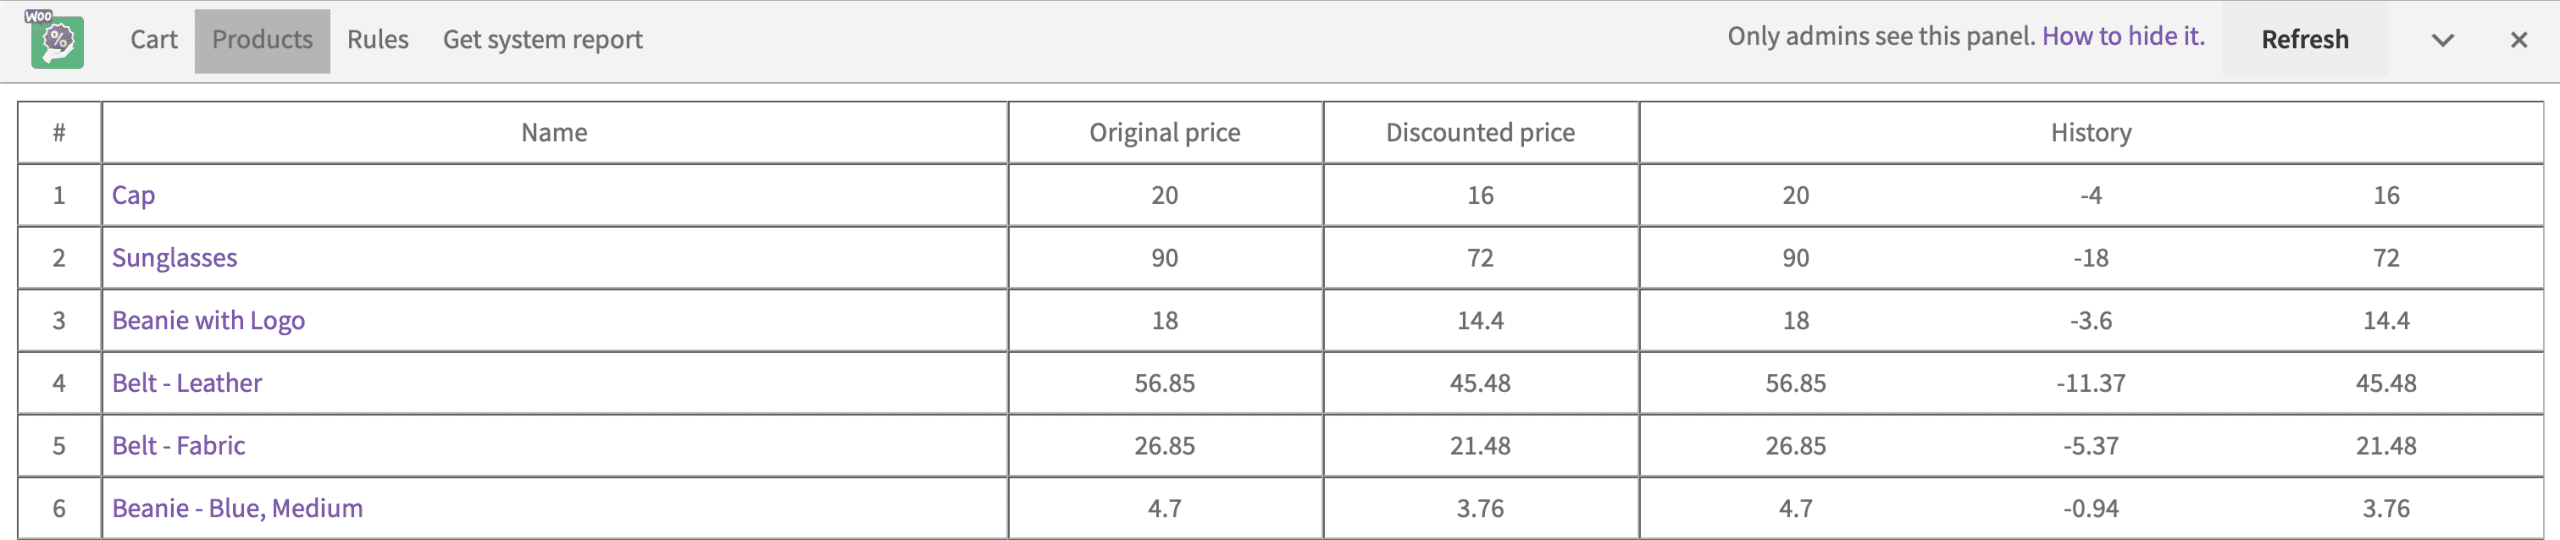
The Products tab shows detailed pricing information for all products the plugin currently considers discounted — not just the ones in the cart. It covers every product on the current page that has an active rule applying to it, including products in the shop loop, on category pages, and on the current product page.
This tab answers questions like “why does this product show a discount on the shop page but not on the product page?” or “is the rule actually targeting this product or just a similar one?” — without needing to add the product to a cart first.
Tab 3 — Rules

The Rules tab shows a complete execution log for every rule the plugin evaluated during the current page load, covering both cart-applied rules and product-page rules. For each rule it reports the execution time in milliseconds, the rule name, and whether the rule applied or not.
Rule names in this tab are clickable links — clicking one opens that rule’s edit screen directly in the admin, so you can jump straight from the debug output to the rule that caused an unexpected result without hunting through your rules list manually.
This tab also helps with performance troubleshooting. If the debug panel shows that a particular rule takes significantly longer to evaluate than others, you can investigate whether the rule’s conditions or filters need simplification.
Tab 4 — System Report

The System Report tab generates a full JSON export of your site’s environment — PHP version, WordPress version, WooCommerce version, plugin version, active plugins, and key plugin settings. When you contact support about an unexpected behaviour, attach the system report JSON to your ticket. It gives the support team all the context they need to reproduce your environment and diagnose the issue efficiently.
To export the report:
- Open the debug panel and click the System Report tab.
- Click Export.
- Attach the downloaded JSON file to your support ticket.
You can also access the System Report directly without enabling the full debug panel at Advanced Dynamic Pricing → Tools → System Report.
Tab 5 — Refresh
The Refresh button reloads the debug panel’s data without reloading the full page. Use it after making a change to a rule or a cart condition to see the updated calculation output immediately — useful when you’re iterating quickly on a rule and want to verify each change without a full browser refresh.
Note: You can also hide the debug bar. Click on the hide button and the debug bar will be shown as a one line panel:

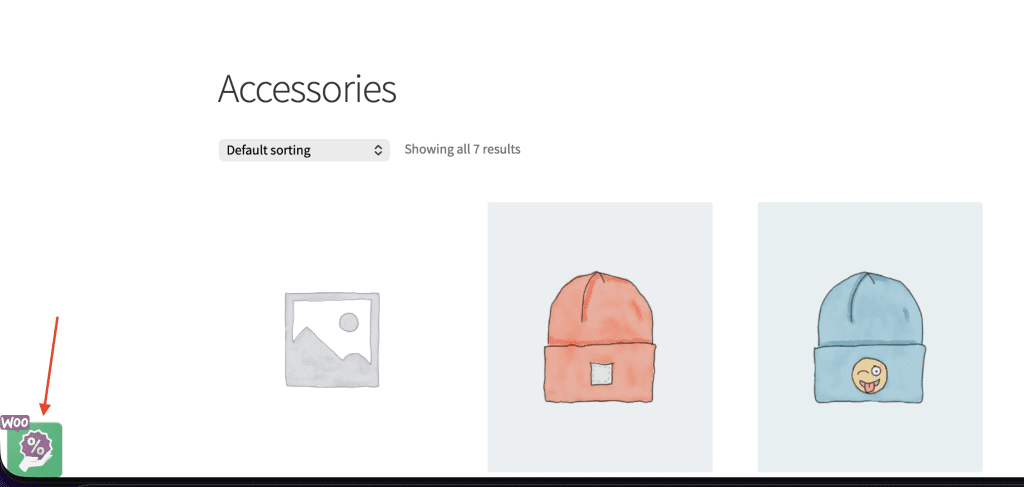
Click on the cross and the debug panel will hide to the icon on the left bottom corner:
What to Look For When Troubleshooting
The debug panel answers the three most common troubleshooting questions about pricing rule behaviour:
“Why isn’t my rule applying?” Open the Rules tab and check whether your rule appears in the execution log. If it doesn’t appear at all, the rule’s product filter or date/time conditions are excluding all products on the current page. If it appears but shows as not applied, check the Cart tab’s Items section for the specific product — the conditions or filters didn’t match.
“Why is the discount amount wrong?” Open the Cart tab → Items and compare the original price and calculated price columns for the affected product. The rule name column identifies exactly which rule produced the value, so you can open it directly and review the discount configuration.
“Which rule is running slowly?” Open the Rules tab and sort by execution time. Rules that evaluate complex conditions against large product catalogues or run expensive database queries take longer. Consider simplifying the product filter or splitting the rule into smaller, more targeted ones.
When Should You Use the Debug Panel?
The debug panel suits any situation where rule behaviour doesn’t match what you configured — a discount that doesn’t appear, a discount that applies to the wrong products, a cart total that looks wrong, or unexpected fee behaviour. It also helps during initial rule setup to confirm that a new rule fires correctly before you publish it to customers, and during performance investigations when you want to identify which rules contribute most to page load time.