Statistics [pro]
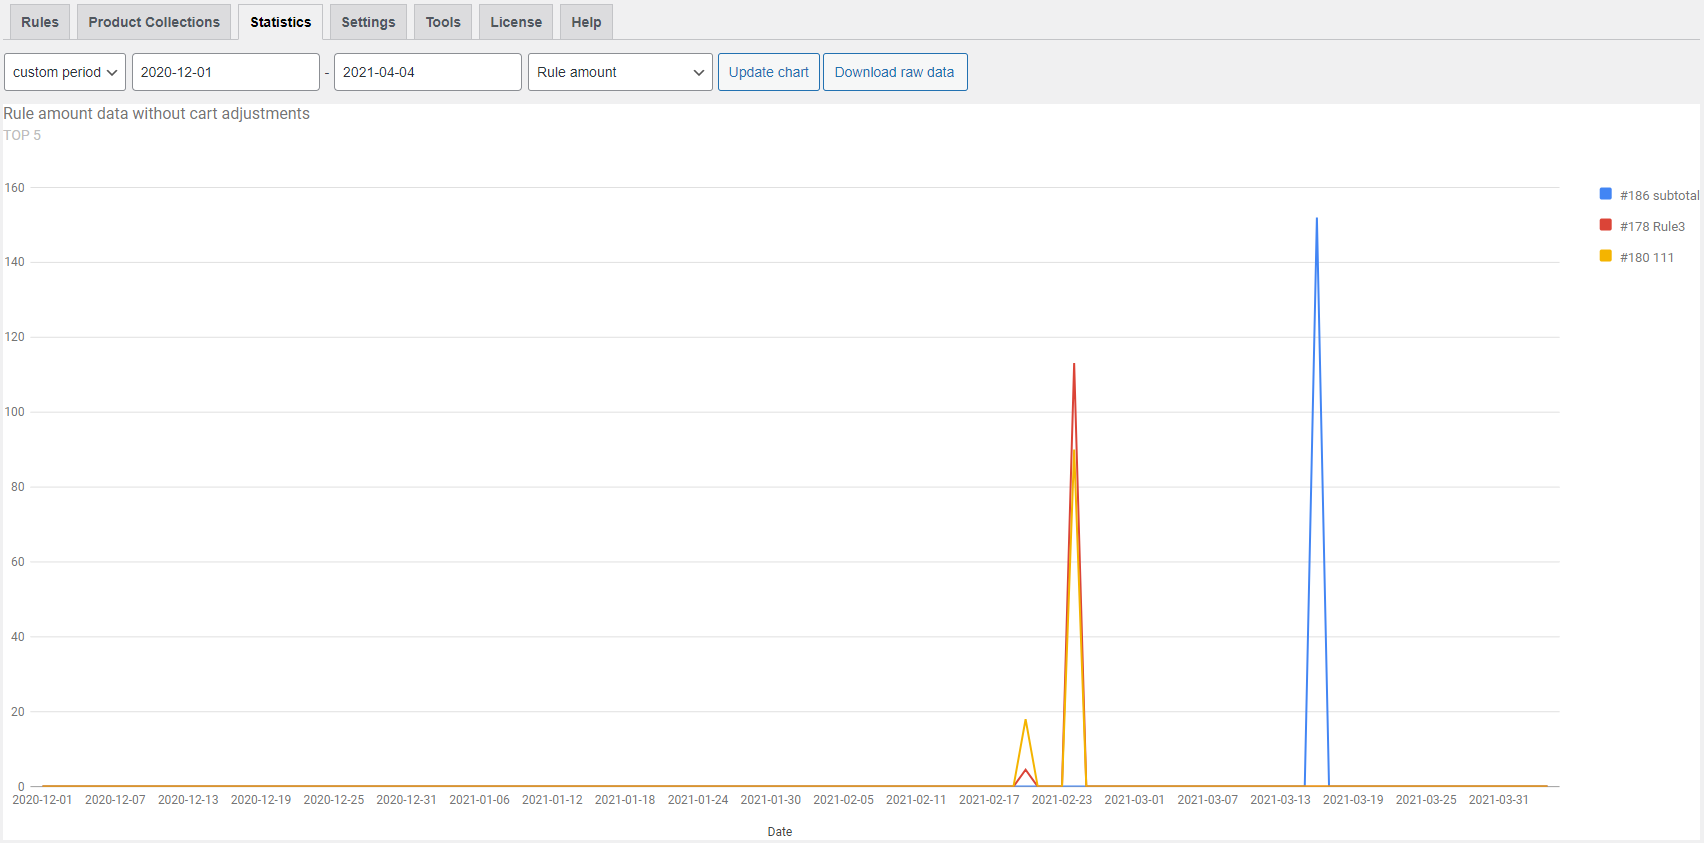
Statistics Pro is a dedicated reporting tool available exclusively in the Pro version of Advanced Dynamic Pricing for WooCommerce. It transforms raw discount data into clear, actionable insights, allowing you to track the performance of your pricing strategies over time.
Why Use Statistics Pro?
Without a dedicated tracking feature, measuring a discount campaign’s effectiveness often requires manual calculation or complex third‑party analytics. Statistics Pro automates this process, giving you immediate access to key performance metrics directly within your WordPress dashboard. This helps you identify your most effective rules, spot underperforming strategies, and make data‑driven decisions to maximise revenue and customer engagement.
The Statistics module generates graphical reports on the application of your pricing rules. You can customise your view by selecting the desired date range and choosing from a set of indicators belonging to two main categories: Rule and Product.
Key Features of Statistics Pro:
- Graphical Reports: Visualise your data through clear, easy‑to‑interpret charts.
- Date Range Filters: Focus your analysis on a specific time period, such as a past campaign or the current quarter.
- Granular Metrics: Analyse performance data from two perspectives:
- By Rule: See how often a specific discount rule was applied and its overall impact on sales.
- By Product: Track the total discount amount applied to individual products, helping you understand which items are frequently bought with a promotion.
- Data Export: Download your generated statistics in a CSV file for offline analysis or integration with other reporting systems.
A Step‑by‑Step Guide to Using Statistics Pro
Accessing and using the Statistics feature is a straightforward process.
- Navigate to the Report: From your WordPress admin dashboard, go to Pricing Rules → Statistics. This will open the main reporting interface.
- Set a Date Range: At the top of the page, use the date picker to define the period you want to analyse. This is crucial for measuring the success of a specific campaign or for generating regular monthly reports.
- Choose Your Indicator and Category: You have two options for generating a report:
- By Rule: This report shows how many times a particular pricing rule has been applied. It is ideal for comparing the popularity of different discount strategies (e.g., BOGO vs. Bulk Discounts).
- By Product: This report calculates the total discount amount applied to a specific product during the selected time frame. This helps identify which products are most frequently discounted, allowing for more targeted future promotions.
- Review the Graph: The page will display a dynamically generated graph based on your selected criteria. Use this visual data to quickly assess the performance of your rules and products.
- Export Your Data: To perform a deeper analysis or to include the report in a presentation, click the Export CSV button. This will download a structured file of your statistics, ready for use in spreadsheet software.
Practical Use Cases
Here are a few ways store owners can use Statistics Pro to improve their business.
Scenario 1: Optimise a Seasonal Sale
You can set the date range to your holiday sale period. Then, generate a “By Rule” report to compare the application count of your “10% off sitewide” rule versus your “Black Friday special” bundle rule. If the bundle rule drives significantly more applications, you can focus your marketing efforts on bundles for the next seasonal event. You can export the CSV for a deep‑dive on the sales data.
Scenario 2: Manage Slow‑Moving Inventory
Go to the “By Product” report and filter by the last 30 days. You will see which products have accumulated the highest total discount amount. If a product has a high discount volume but still a large inventory, it may indicate that a stronger discount or a different marketing angle is needed to clear the stock.
Summary
The Statistics Pro module in Advanced Dynamic Pricing for WooCommerce provides a clear window into your discount campaign performance. By offering graphical reports, date‑range filters, and two distinct analysis categories (By Rule and By Product), it enables you to track which promotions engage customers and which products benefit the most from discounts. The ability to export this data to CSV further empowers you to make informed, data‑driven decisions to refine your pricing strategy.